Data Visualization - Week 1
My name is Sidon Duarte, I am a Developer from Brazil, besides, I am a data science lover, on June 27, 2016, I enrolled in Data Management and Visualization course by Wesleyan University, via coursera. In this course, the assignments must be submitted on a blog entry, after some hours of research, I chose Github for this task, mainly by convenience and the cleaning and focus sensation.
About the course:
This is the first course of the five in the Data Analysis and Interpretation Specialization detailed information about it can be seeing here.
Assignment 1:
On this first assignment, the student has to choose one of five codebooks provided and two topics on it. This post is my submission.
Step 1: Choose a dataset that you would like to work with.
After reviewing the five provided codebooks, I have opted the “portion of’ GapMinder, The main reason for my interest in this data set was because of the global context, especially, in regarding health data.
Step 2: Identify a specific topic of interest.
As I’m not that young anymore, I have been seeing some of my friends died of many causes. One of them has been drawing my attention: complications resulting from excessive alcohol consumption. I envisaged the possibility of investigating the correlation between the expectancy life and the alcohol consumption when I analyzed the Gapminder codebook.
Step 3: Prepare a codebook of your own.
Although the portion of Gapminder provided, is a little piece, I chose to cut the only variables that I think I will use. This is presented bellow:
| Variable Name | Description of Indicator | Main Source |
| incomeperperson | 2010 Gross Domestic Product per capita in constant 2000 US$. The inflation but not the differences in the cost of living between countries has been taken into account. | World Bank Work Development Indicators |
| alcconsumption | 2008 alcohol consumption per adult (age 15+), litres Recorded and estimated average alcohol consumption, adult (15+) per capita consumption in litres pure alcohol | WHO |
| lifeexpectancy | 2011 life expectancy at birth (years) The average number of years a newborn child would live if current mortality patterns were to stay the same. | 1. Human Mortality Database; 2. World Population Prospects; 3. Publications and files by: history prof. James C Riley; 4. Human Lifetable Database |
Step 4: Identify a second topic that you would like to explore in terms of its association with your original topic.
Since the first moment that I looked the Gapminder codebook, I saw the possibility to explore the possible relationship between alcohol consumption and life expectancy, and, also, the possible correlation between Socioeconomic status and alcohol consumption.
Research Question:
There is a direct relationship between the alcohol consumption and life expectancy?
Step 5: Add questions/items/variables documenting this second topic to your personal codebook.
Ok, as I mentioned in Step 4, since first look on the Gapminder codebook, I had thought about the second topic. Thus, the codebook was done with this in mind.
Step 6: Literature Review.
I did do my research in the Google Scholar with the string: “alcohol consumption life expectancy”. Bellow the image of this search is showed.
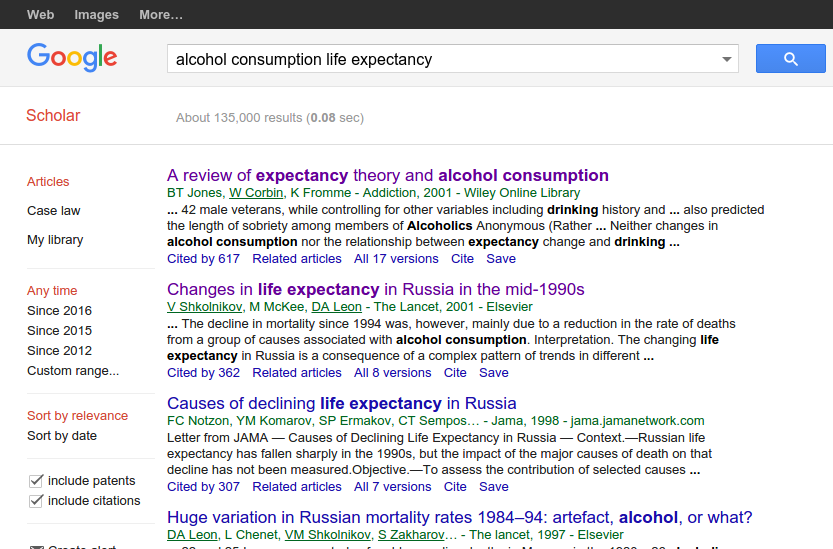
My original plan was to do an in-depth investigation of the chosen topics. Due to the short time and the fact that most articles are accessible only through pay assign, I opted by to select some papers and to analyze their abstracts and the open sections (frequently, “results’’ and “conclusions”). Three of these papers are summarized bellow.
Changes in life expectancy in Russia in the mid-1990s [1]
In this article, the authors state that the life expectancy in Russia has been changing due to the intricate pattern of trends in different causes of death, where some of which have their origins long in the past and others that results for contemporary circumstances. In the words of authors, the study provides further support for the view that alcohol has played an important part in the fluctuations int life expectancy in Russia in the 1990s.
Drinking Pattern and Mortality:: The Italian Risk Factor and Life Expectancy Pooling Project [2]
The purpose of this article is exactly to analyze the relationship between a particular aspect of drink pattern and a risk of all-cause and specific-cause mortality The results presented in this paper indicate that drinking patterns may have important health implications, impacting directly on the life expectancy.
Alcohol-related mortality by age and sex and its impact on life expectancy. Estimates based on the Finnish death register [3]
This study was made in Finland and based on the “Finnish Death Register” that includes information on both the underlying and contributory causes of death and it yields an individual-level estimate of the contribution of alcohol to mortality. The data for 1987-1993 are used to examine alcohol-related mortality by cause of death. According to the results, 6% of all deaths were alcohol related. These deaths were responsible for a 2 year loss in life expectancy at age 15 years among men and 0.4 years among women.
Step 7: Based on your literature review, develop a hypothesis about what you believe the association might be between these topics. Be sure to integrate the specific variables you selected into the hypothesis.
The observing the open sections of these articles is enough to establish the correlation between alcohol consumption and life expectancy, at least in those local contexts. After this observations, I developed my hypothesis:
Primary hypothesis:
The level of alcohol consumption of a country might be directly related to expectancy life.
Secondary hypothesis:
Socioeconomic status and income levels have a direct correlation with the level of alcohol consumption of a country.
Reference
[1] Shkolnikov, V.; McKee, M.; Leon, D. Changes in life expectancy in Russia in the mid-1990s. The Lancet, v. 357, n. 9260, p. 917-921, 2001.
[2] Trevisan, M. et al. Drinking Pattern and Mortality:. Annals of Epidemiology, v. 11, n. 5, p. 312-319, 2001.
[3] Streppel, M. et al. Long-term wine consumption is related to cardiovascular mortality and life expectancy independently of moderate alcohol intake: the Zutphen Study. Journal of Epidemiology & Community Health, v. 63, n. 7, p. 534-540, 2009.