Data Analysis Tools - Week4 | Exploring Statistical Interactions
This is the fourth assignment or the second course (of five) [Data Analysis and Interpretation Specialization] (https://www.coursera.org/specializations/data-analysis) detailed information about it can be seeing here.
Assignment 4:
The fourth assignment deals with testing a potential moderator. When testing a potential moderator, we are asking the question whether there is an association between two constructs for different subgroups within the sample.
In name of clarity I opted, in this assignment, by not show the code fragments, but, instead, show the sections on this notebok.
Index
- Variables
- Question
- Creating Categorical Variables
- Analysis of Variance ANOVA
- Means for each level of income
- Graphs for means
- Conclusion
- Entire code
Variables
Details of my project can be seeing here, to get easier, I made a summary bellow:
| Variable Name | Description |
|---|---|
| Life | Explanatory Variable: Life Expectancy (1) |
| Alcohol | Response Varialbe: Alcohol Consumption (2) |
| Income | moderator: GPD per capita (3) |
(1) 2008 alcohol consumption per adult (liters, age 15+)
(2) 2011 life expectancy at birth (years)
(3) 2010 Gross Domestic Product per capita in constant 2000 US$”
Question
The income level affect direction or strength of the relationship between alcohol consumption and life expectancy?
Creating Categorical Variables
originally, my variables are all numeric, that is, “life” is expressed in the number of years, “alcohol” is expressed in the number of liters and “income” in dollars. For this assignment the only variables that i keep numeric is the “life”, alcohol and income will be converted in categorical based in means.
Means
Means
| alcohol | income |
|---|---|
| 6.78409 | 7006.36 |
The code for this table can be seeing in section [2] on this jupyter notebok
Categorical variables:
The code for creation this variables can be seeing in section [2][3], this jupyter notebok, bellow I show the output for dtypes:
| variable | Type |
|---|---|
| country | object |
| income | category |
| alcohol | category |
| life | float64 |
Analysis of Variance ANOVA
To accomplish to answer our question, we are going to run two separate ANOVAS, one for each level of third variable (income less than or greater than the mean)
Anova for income less than the mean
ANOVA results for income less than the mean (US$ 7006)
| F-Value | P-value |
|---|---|
| 3.37363 | 0.0686231 |
This results of ANOVA shows a smal F-Value and a not significant P-value,
Anova for income greater than the mean
ANOVA results for income greater than the mean (US$ 7006)
| F-Value | P-value |
|---|---|
| 13.0789 | 0.000794359 |
In this case, the results show an f-value a little greater and a significant p-value.
The code for this table can be seeing in section [5] on this jupyter notebok
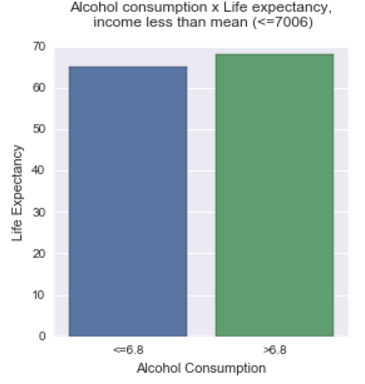
Means for each level of income
Means for life expectancy by alcohol consumption > 6.78 (mean of alcohol consumption) vs. alcohol consumption < 6.78 for income < 7006 (mean of income in dollars).
| alcohol | life |
|---|---|
| <=6.8 | 65.2091 |
| >6.8 | 68.2592 |
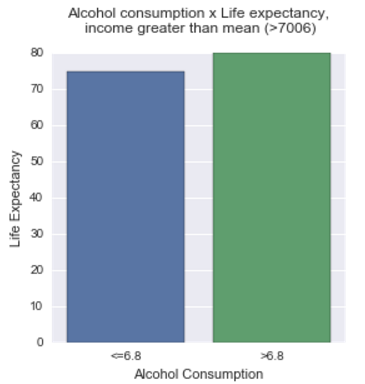
Means for life expectancy by alcohol consumption > 6.78 (mean of alcohol consumption) vs. alcohol consumption < 6.78 for income > 7006 (mean of income in dollars).
| alcohol | life |
|---|---|
| <=6.8 | 74.6213 |
| >6.8 | 79.9717 |
The code for this table can be seeing in section [6][7] on this jupyter notebok
Graphs for means
Conclusion
The results of the Analise of variances shows that in the level of income less than the mean (7006 dollars) the income level not affects the direction or strength of the relationship between alcohol consumption and life expectancy, In the other hand, in the income levels greater than the mean, this affects the life expectancy when the alcohol consumption is greater than the mean, greater is the life expectancy. Is need to note that this is not a scientific work and the data can lead an erroneous interpretation.
See the entire code for this week here.